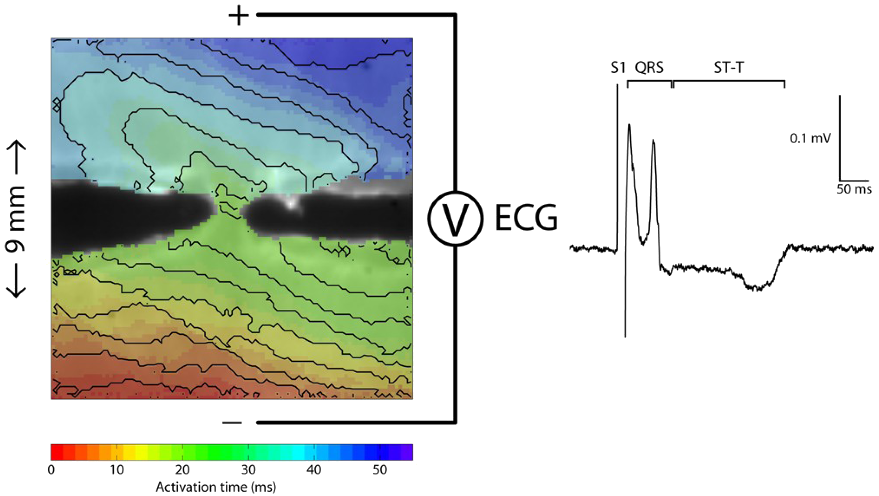
Illustration of the experimental method used in this paper. This figure shows an optical map and pseudo-ECG of a porcine epicardial shaving after the introduction of isthmuses during stimulation from below. Colors correspond with local activation times, lines are 2.5-ms isochrones, viewing window is 9 by 9 mm. The tracing shows the QRS complex and ST-T segment of the pseudo-ECG.
Adapted from figure 1 in:
ST-Segment Elevation by Current-to-Load Mismatch: An Experimental
and Computational Study
Heart Rhythm 8:111-118, January 2011